01
Alert fatigue
Drowning in alerts at 3 AM, manually checking dashboards one by one. Forty-five minutes of triage before investigation even begins.
29 containers, one command133 features · 58 ADRs$0 licence · your infrastructureHow we compare →
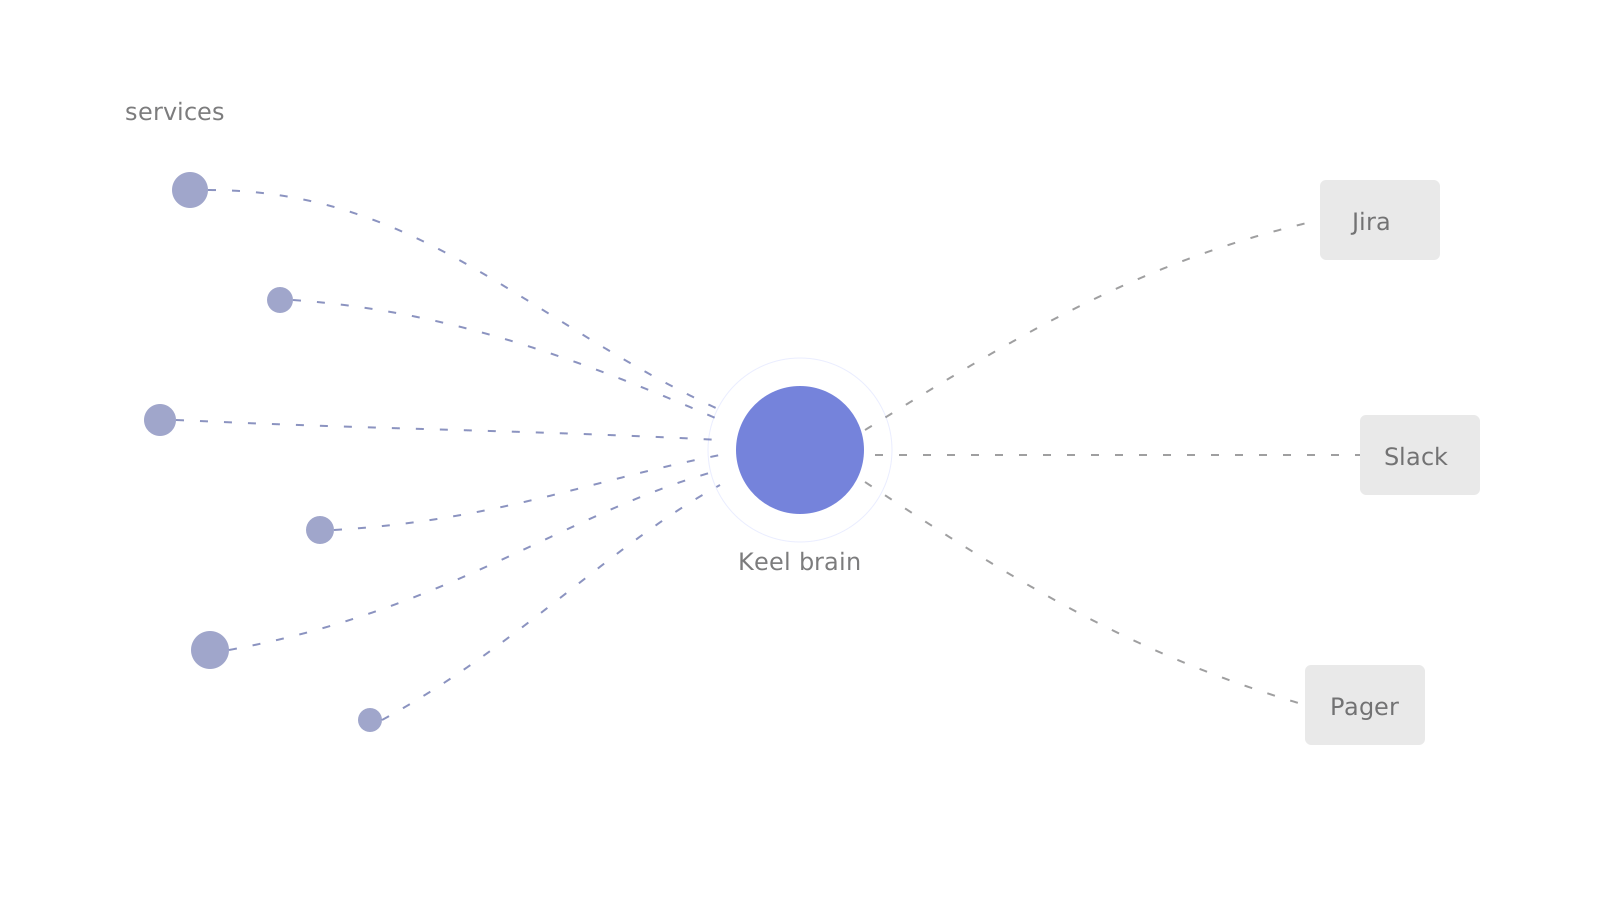
Most AI SRE tools are someone else's SaaS reading your telemetry. Keel is the whole stack — Prometheus, Mimir, Loki, Tempo, Grafana, OTel and the AI brain — running inside your perimeter, on your keys, under Apache 2.0. Bring your own LLM. Bring your own observability stack, or take ours.
Every number on this page is countable from a clone. git clone, make all, five minutes.
Drowning in alerts at 3 AM, manually checking dashboards one by one. Forty-five minutes of triage before investigation even begins.
Grafana, kubectl, Splunk, PagerDuty. Every tool is a tab, every tab is a context switch, every switch is minutes lost.
When your senior SRE leaves, the investigation playbooks walk out the door. Each new incident feels like starting from scratch.
Keel meets you where you are. Ship the full observability stack in one command, or plug the AI brain into the stack you already run.
Bring Your Own Stack. Point Keel at your existing Prometheus, Loki, and Tempo via three environment variables. Multi-tenant, hardened, and ready for audit.
X-Tenant-ID isolationFull stack mode spins up 29 containers - Prometheus, Mimir, Loki, Tempo, Grafana, Jaeger, OTel, Alertmanager, MinIO - plus the AI brain. Five minutes from clone to first investigation.
make all - 5-minute demo in 29 containersOTLP traces, PromQL metrics, LogQL logs, TraceQL spans, webhooks for alerts. Nothing to rewrite.
 Prometheus
 Grafana
 Loki
 Tempo
 Mimir
 Jaeger
 OpenTelemetry
 Alertmanager
 MinIOPrometheusGrafanaLokiTempoMimirJaegerOpenTelemetryAlertmanagerMinIO
 Kubernetes
 Docker
 Terraform
 Helm
 Neo4j
 PostgreSQL
 Redis
 Vault
 Jira
 ServiceNow
 Slack
 Teams
 PagerDutyKubernetesDockerTerraformHelmNeo4jPostgreSQLRedisVaultJiraServiceNowSlackTeamsPagerDuty
133 features shipped across nine benchmarked pillars.
Every incident runs a structured pipeline — error rate, latency, cascade detection, logs, traces, LLM enrichment — with a confidence-gated re-investigation loop.
Per-model circuit breakers. Four load-balancing algorithms. Priority queue. $50/day cost cap. Self-healing daemon. Kill switch.
Triage, Investigate, Remediate, Awaiting Resolution, Resolved. Human-in-the-loop approval for P1. Jira auto-transitions. Postmortems on closure.
Risk-based alert scoring inspired by Splunk RBA. KPI health trees across weighted dimensions. YAML-defined correlation searches. Investigation workbench with disposition tracking.
Integration registry with auto-discovery and YAML hot-reload. The ingestion queue runs in-process today — a durable broker is a design target, not a shipped backend. Service membership is a static list. Offline LoRA fine-tuning script for your own RCA corpus.
Episodic memory with multi-factor similarity matching. Two similar episodes? Keel synthesises a strategy and injects it into the next investigation.
Confidence breakdown. "Why this RCA?" evidence trail. Full decision audit log — triage, scoring, runbook, escalation — with 30-day retention. SOC 2 ready.
From alert to resolution — fully automated, human-gated.
Alertmanager webhook hits. Keel deduplicates via SHA256 fingerprint, assigns an incident ID, computes priority from severity + blast radius.
PromQL error rates, latency, cascade detection, LogQL, TraceQL, LLM enrichment — with episodic memory injected as context.
Priority ≥ 0.8 gates for human approval. On confirm: Jira Done, postmortem to Slack + ServiceNow, episode written to memory.
The technical numbers that separate a side project from a platform.
Traces, metrics, logs over OpenTelemetry. Every signal, one pipeline.
Priority queue + circuit breakers + multi-backend routing. Production-calibrated.
One Docker Compose file. Five minutes from clone to first investigation.
Neo4j-backed service topology traversal. Knows which services are downstream before the first signal lands.
Most tools tell you what they do. We tell you why we built it that way.
We chose LangGraph over a linear pipeline because incident response is inherently stateful - a low-confidence investigation must be able to loop back and re-investigate with different context. The Router node gates this: confidence < 0.70 returns to Investigate for up to 2 retries before escalating to a human. Remediate only runs for P1/P2 incidents with LLM-enriched runbook steps. Notify runs unconditionally but in parallel fan-out to minimise time-to-Slack.
Running three backends (Ollama local, Anthropic, OpenAI) with different latency and cost profiles required production patterns - not just retry logic. Circuit breakers open per model after three consecutive failures and retry in half-open state after 30s. A self-healing daemon polls Ollama every 20s and auto-restarts failed models. Priority queue ensures CRITICAL alerts skip ahead of INFO. Sliding-window rate limiter caps spend at $50/day by default, configurable via env var. Kill switch via POST /pause for incident response.
LLMs are overconfident. We learned this after shipping the first version with a pure LLM self-rating and seeing 95% claimed confidence on RCAs that were wrong. The current formula blends the LLM's rating (40%) with actual signal coverage - how many of the six RCA steps returned useful data (60%) - and then applies a bonus/penalty based on whether the service has a history of accurate RCAs. This is the single most important reliability improvement we shipped.
We didn't want a RAG-over-logs approach - that's just search. Episodic memory stores structured episodes and matches new incidents against past ones using weighted similarity. When two or more similar episodes exist, we synthesise a strategy and inject it into the LLM prompt before the new investigation runs. This is the compounding-learning loop.
We scored Keel against 28 tools across 92 criteria and nine weighted pillars. We wrote the criteria, we scored our own product, and we scored theirs from public documentation without hands-on testing — so treat this as a capability map, not a league table. On a separate, stricter panel that weights market proof alongside capability, Keel comes second: 7.95 against Datadog's 8.01. We are publishing both, including the one where we lose.
How this benchmark was made, and where it is biased →
Here is the part that is not close. Among tools you can self-host, air-gap and run on your own LLM keys, nothing else ships this much. Datadog and Dynatrace cannot deploy inside most bank perimeters. incident.io, PagerDuty and Rootly are SaaS-only. Cleric and the pure-plays have no observability stack of their own. Keel is 29 containers and a Docker Compose file.
BUILT BY
I wrote Keel the way I'd want an AI to help me at 3 AM, around three principles: investigations should be structured, not improvised. Memory should compound, not evaporate when a senior engineer leaves. And AI should propose, never execute - the human always signs off. No magic, no autonomy theatre - just a faster first ten minutes.
Gurpreet Singh - Creator · Engineer · Writer · LinkedIn →
One command. Full stack. Zero vendor lock-in.